2. Normal Test
Here the Normal Test is used to calculate the power of the test or the sample size.
Example 1:
A quality supervisor wants to test, based on a random sample of size n = 35 and for a significance level $\alpha$ = 0.05, if the average depth of a hole in a given part is 72.4mm. What is the power of the test to detect a difference of 1.2 between the actual average of the population and the mean established by the null hypothesis if we know, previous information, that $\sigma$ = 2.1 mm?
First let’s establish the hypotheses:
- $H_0$: $\mu = $ 72.4 mm
- $H_1$: $\mu\neq$ 72.4 mm
To calculate the power of this hypothesis test, we will use the following data
| $\mathbf{\sigma}$ | $\mathbf{n}$ | $\mathbf{\alpha}$ | diferença |
| 2.1 | 35 | 0.05 | 1.2 |
To perform the Normal test, the following configuration is made, which is shown in the following figure.
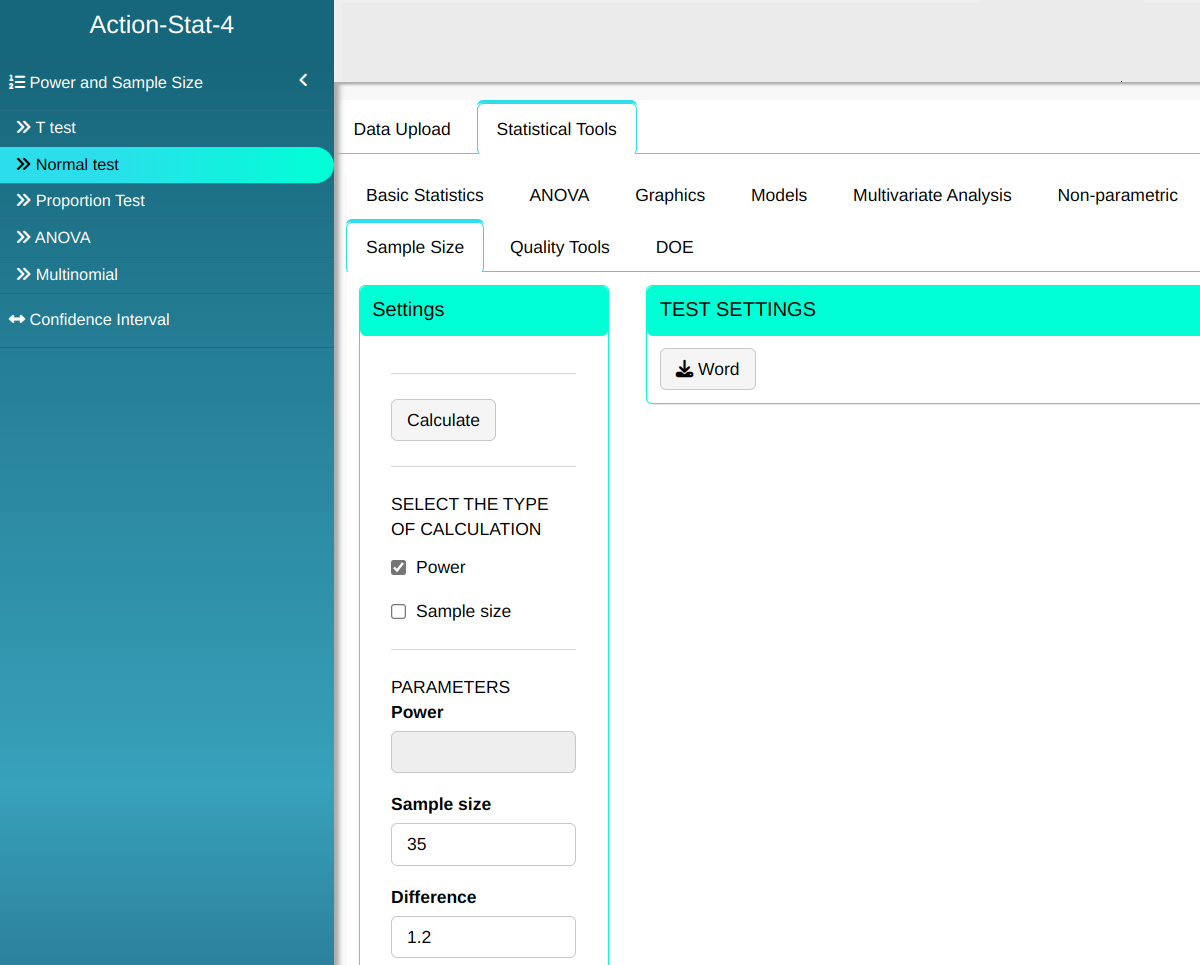

Then click Calculate we obtain the results. You can also generate the analyses and download them in Word format.

The results are:
Normal test
| V1 | |
|---|---|
| Power | 0.9222912 |
| Sample size | 35 |
| Difference | 1.2 |
| Standard deviation | 2.1 |
| Significance level | 0.05 |
| Alternative Hypothesis | Different |
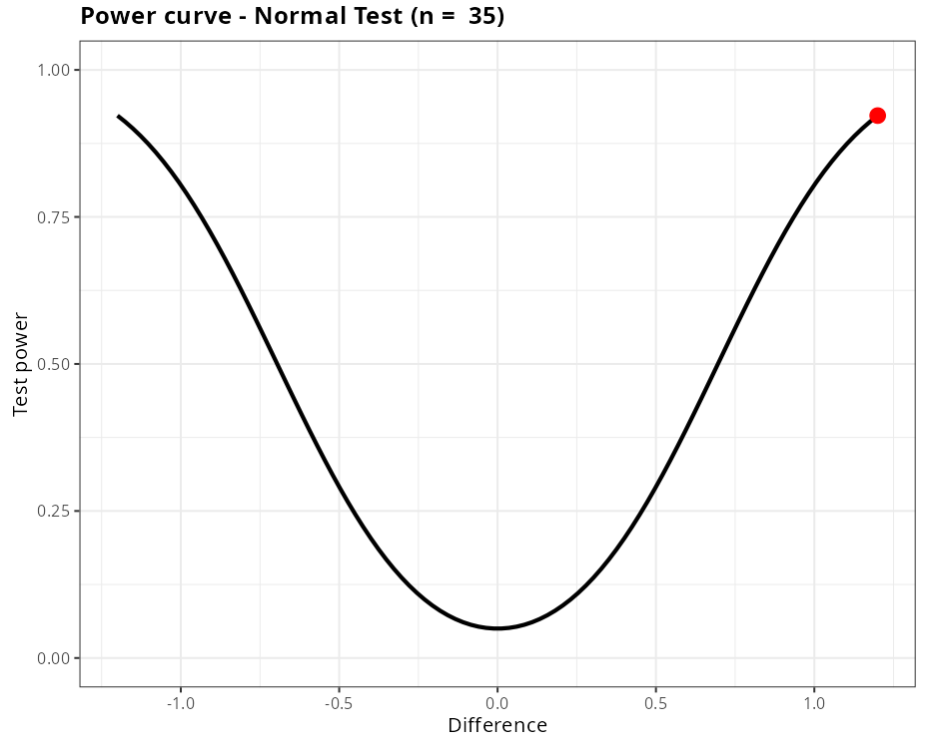
With this, we conclude that the power of hypothesis testing to detect a difference d = 1.2 between the real value of the population mean and the value established by the null hypothesis is approximately 92.23%.
Example 2:
What is the sample size necessary so that, at a level of significance $\alpha$ = 0.05, a normal hypothesis test detects a difference d = 0.6 between the population mean and the mean established by the null hypothesis with power of at least 0.9 knowing from previous information that $\sigma$ = 2.1 mm?
First let’s establish the hypotheses:
- $H_0$:$\mu $ =72.4 mm
- $H_1$:$\mu$ $\neq$ 72.4 mm
We will use the data from the table below:
| $\mathbf{\sigma}$ | Poder | $\mathbf{\alpha}$ | diferença |
| 2.1 | 0.9 | 0.05 | 0.6 |
To perform the Normal test, the following configuration is made, which is shown in the following figure.
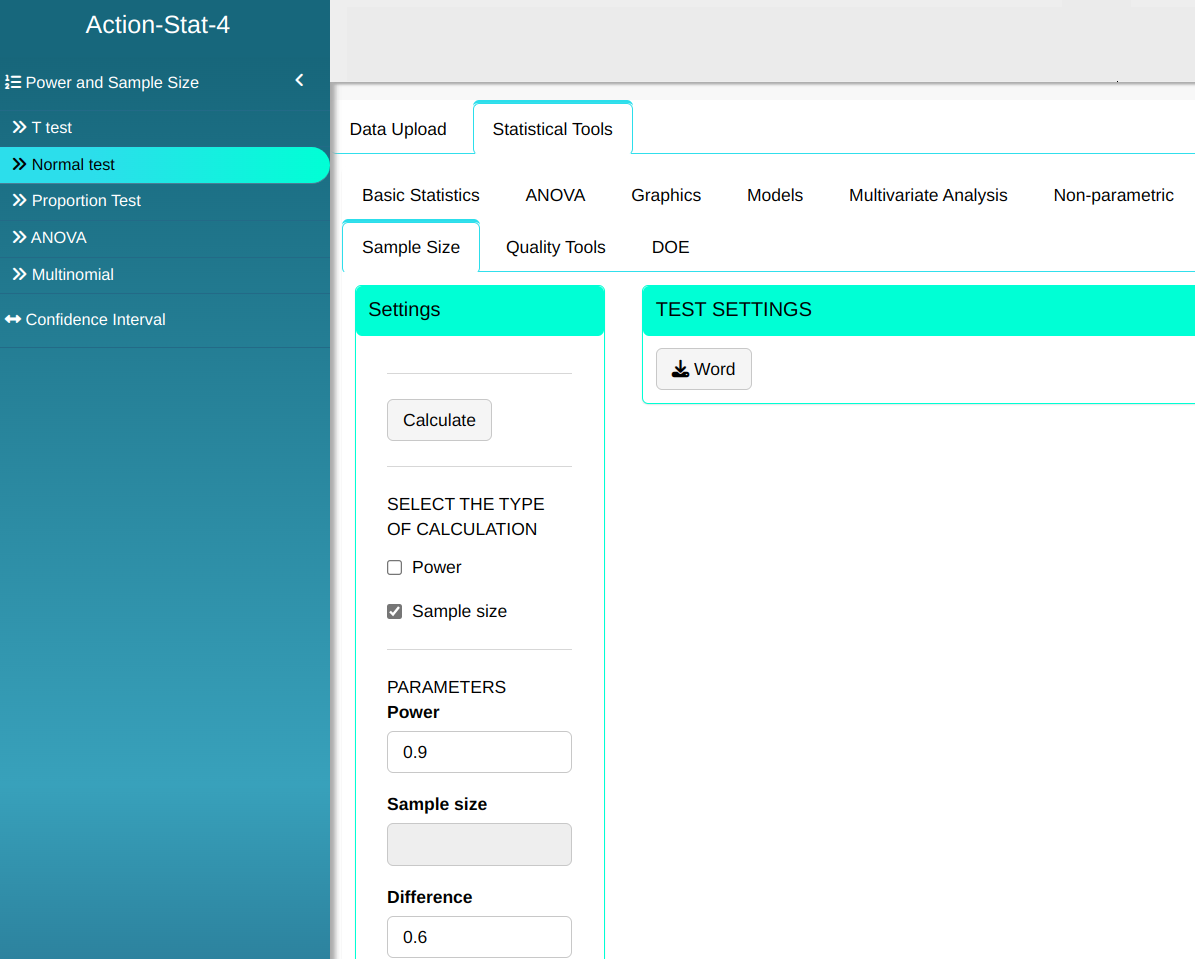

Then click Calculate we obtain the results. You can also generate the analyses and download them in Word format.
The results are:
Normal test
| V1 | |
|---|---|
| Power | 0.9 |
| Sample size | 129 |
| Difference | 0.6 |
| Standard deviation | 2.1 |
| Significance level | 0.05 |
| Alternative Hypothesis | Different |
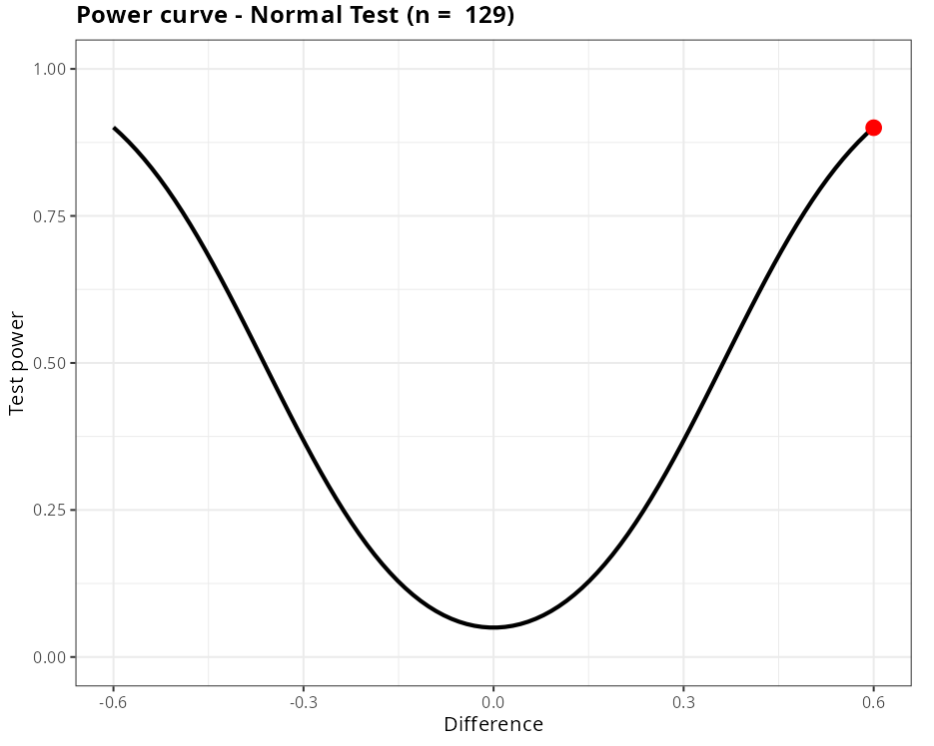
Therefore, for the test to detect a difference of 0.6 with a power of, at least 0.9, a sample size of 129 elements is required.
Example 3:
The production manager of a company aims to evaluate the performance of a new teaching methodology for new workers hired. With the old methodology, there is an average rate of 4 errors per worker in the first week of work. In a sample of 25 workers, the new methodology was applied and it was observed that the average was of 5 errors per week with a standard deviation of 2. With this information calculate the power of the test to detect a difference d = 0.25 between the true rate and the rate of the null hypothesis with a significance level $\alpha$ = 0.05.
We will use the data in the table below:
| $\mathbf{\sigma}$ | $\mathbf{n}$ | $\mathbf{\alpha}$ | diferença |
| 2 | 25 | 0.05 | 1 |
To perform the Normal test, the following configuration is made, which is shown in the following figure.
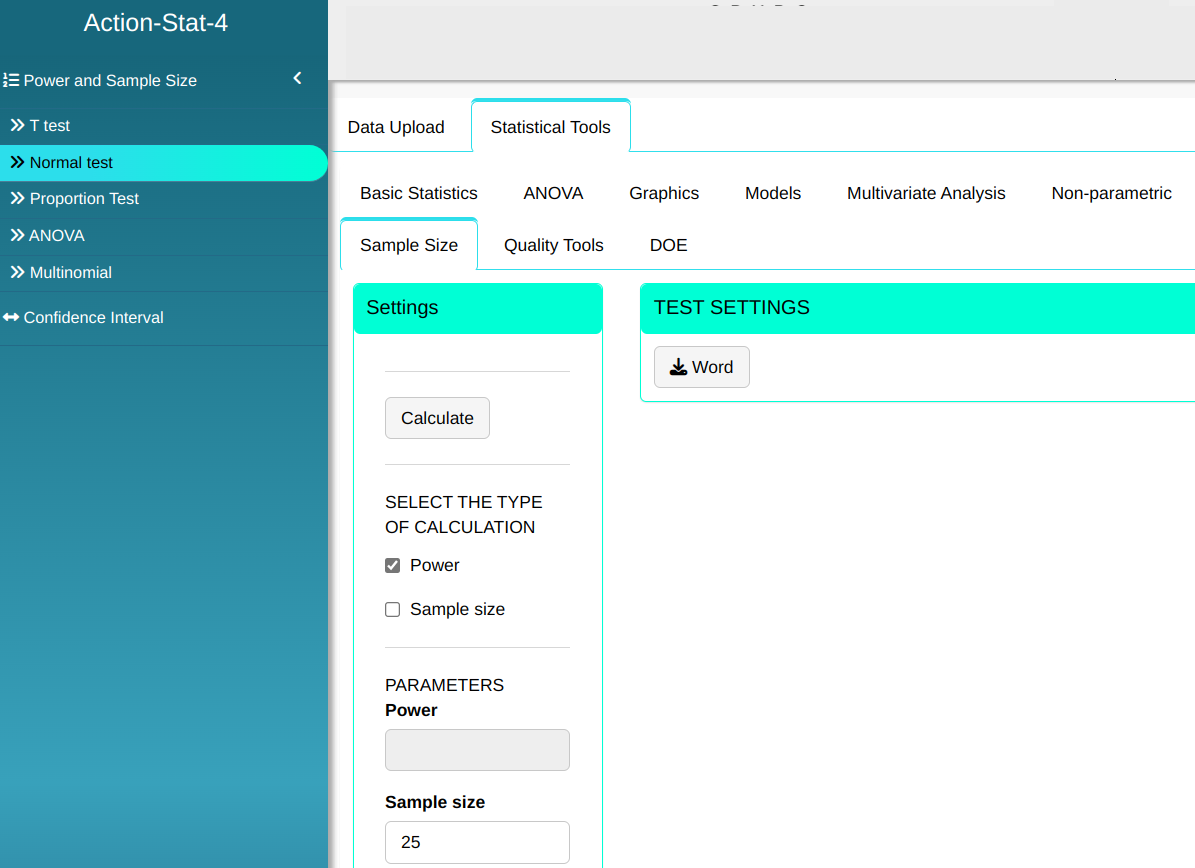

Then click Calculate we obtain the results. You can also generate the analyses and download them in Word format.
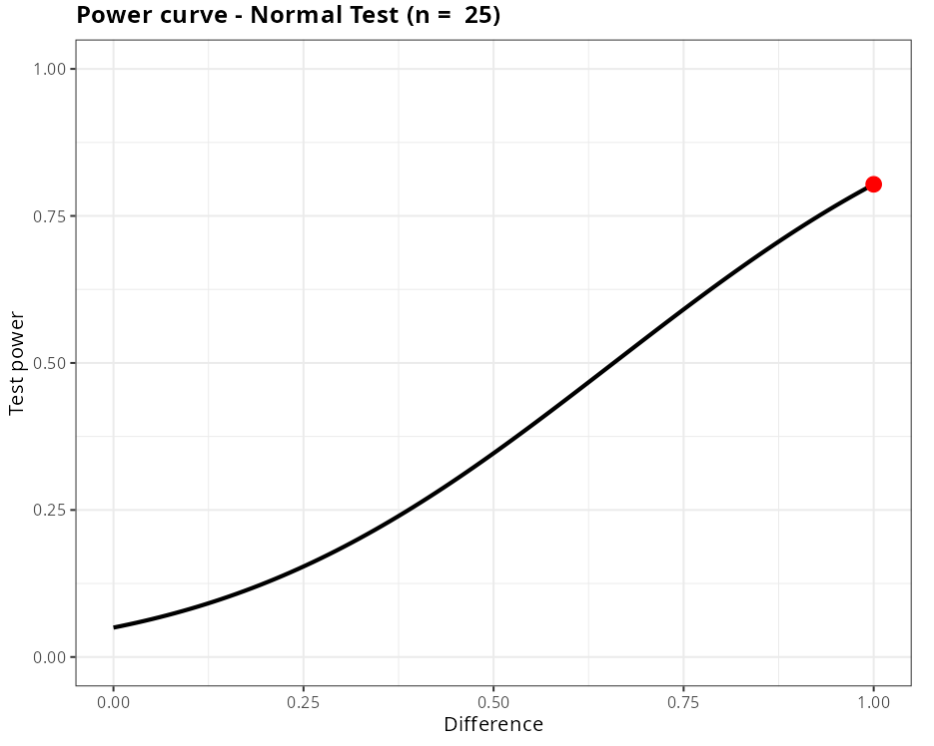
The results are:##
Normal test
| V1 | |
|---|---|
| Power | 0.8037649 |
| Sample size | 25 |
| Difference | 1 |
| Standard deviation | 2 |
| Significance level | 0.05 |
| Alternative Hypothesis | Greater than |
Example 4:
The production manager of a company aims to evaluate the performance of a new teaching methodology for new workers hired. With the old methodology, there is an average rate of 4 errors per worker in the first week of work. In a sample of 25 workers, the new methodology was applied and it was observed that the average was 5 errors per week. Knowing that the standard deviation is equal to 2, calculate the sample size necessary for the test to detect a difference d = 0.25 between the real rate and the rate assumed by the null hypothesis with power from at least 0.9 to a significance level α = 0.05.
Use the data from the table below:
| $\mathbf{\sigma}$ | Poder | $\mathbf{\alpha}$ | diferença |
| 2 | 0.9 | 0.05 | 0.25 |
To perform the Normal test, the following configuration is made, which is shown in the following figure.
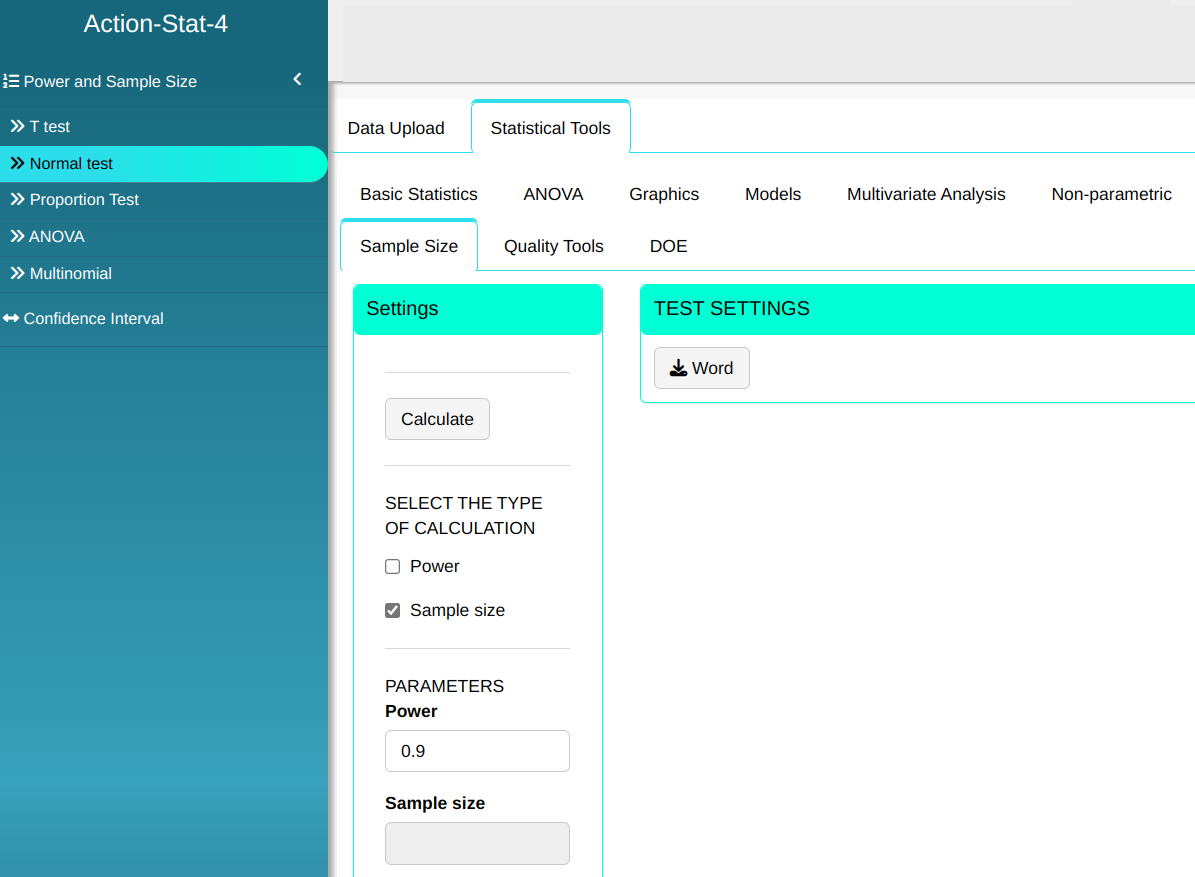

Then click Calculate we obtain the results. You can also generate the analyses and download them in Word format.
The results are:
Normal test
| V1 | |
|---|---|
| Power | 0.9 |
| Sample size | 549 |
| Difference | 0.25 |
| Standard deviation | 2 |
| Significance level | 0.05 |
| Alternative Hypothesis | Greater than |
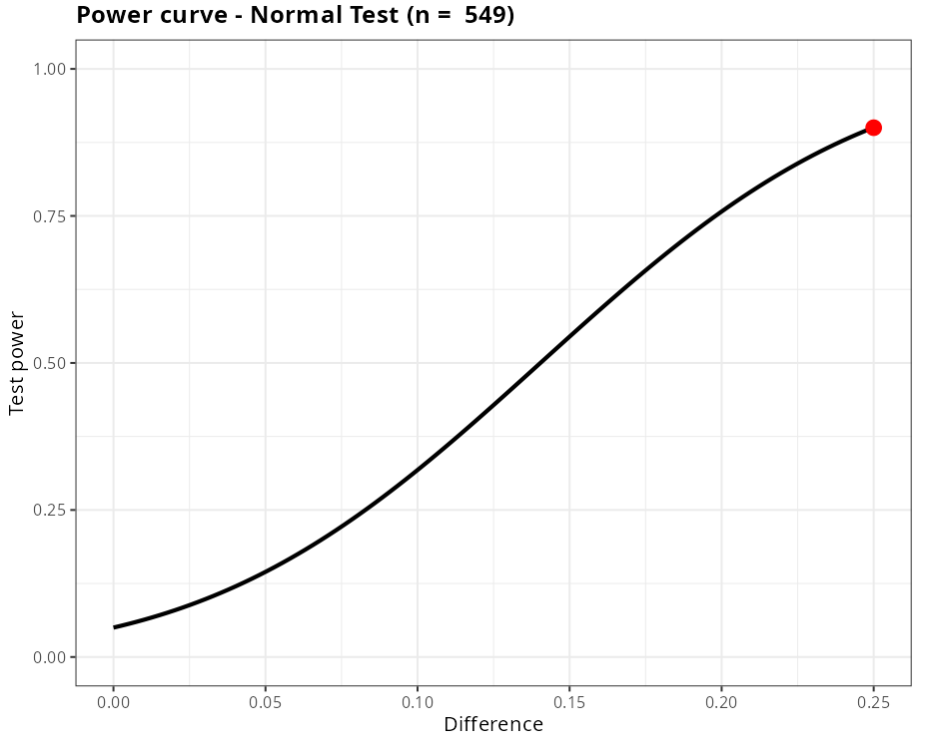
In other words, for the test to detect a difference d = 0.25 with a power of at least 0.9, we need to take a sample of 549 elements.