5. Performance Indices - Pp/Cp (Automatic)
In many cases it is advisable to have a tool that allows the capacity of a process to be assessed automatically, using the model that best fits the data under study.
Example:
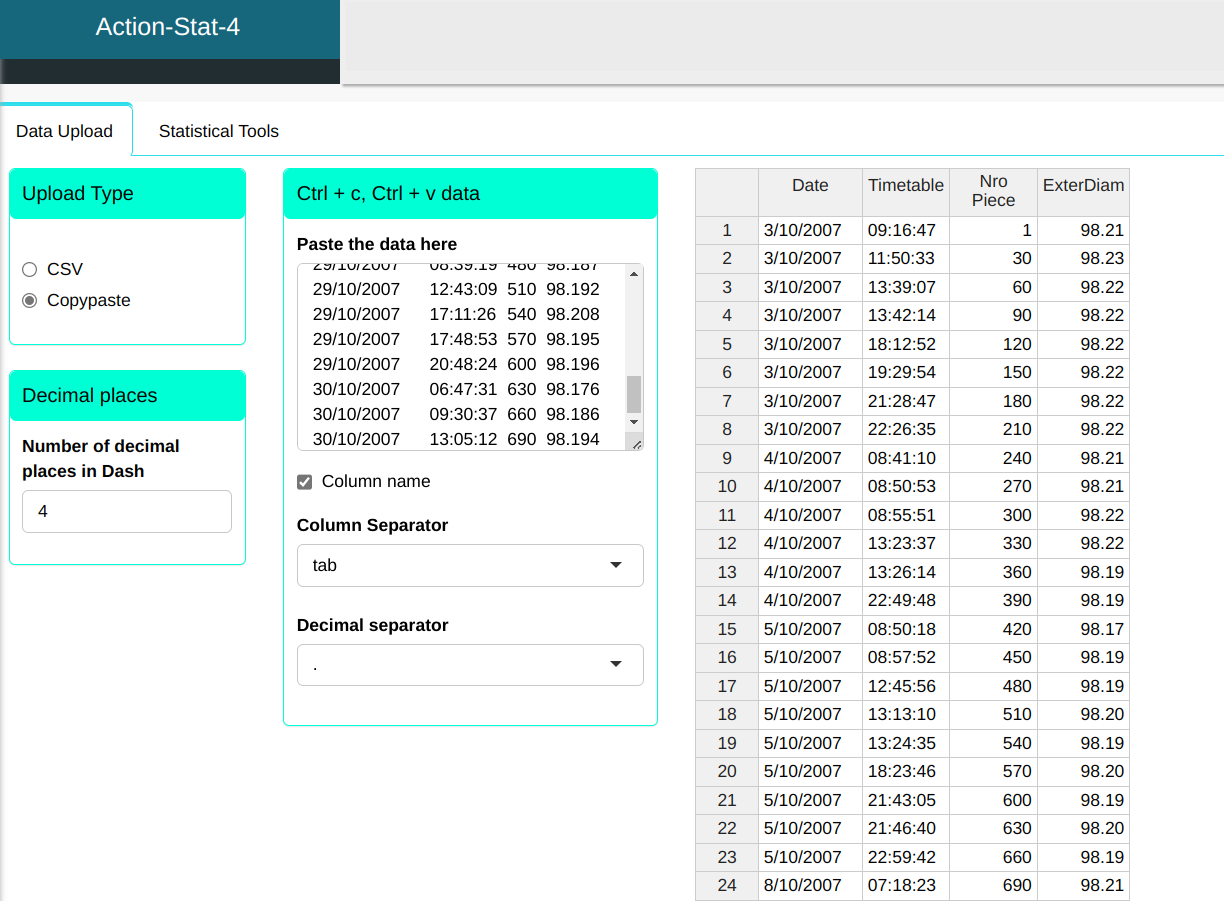
The following data refers to checking the distance between the teeth of a transmission gear. Every thirty pieces produced, the last piece was taken to the laboratory to be measured on a coordinate measuring machine. For this example we have LSL = 98.25 e USL = 98.15.
| Date | Timetable | Nro Pieceº | Exter Diame |
|---|---|---|---|
| 3/10/2007 | 09:16:47 | 1 | 98.212 |
| 3/10/2007 | 11:50:33 | 30 | 98.23 |
| 3/10/2007 | 13:39:07 | 60 | 98.218 |
| 3/10/2007 | 13:42:14 | 90 | 98.215 |
| 3/10/2007 | 18:12:52 | 120 | 98.216 |
| 3/10/2007 | 19:29:54 | 150 | 98.22 |
| 3/10/2007 | 21:28:47 | 180 | 98.219 |
| 3/10/2007 | 22:26:35 | 210 | 98.216 |
| 4/10/2007 | 08:41:10 | 240 | 98.207 |
| 4/10/2007 | 08:50:53 | 270 | 98.208 |
| 4/10/2007 | 08:55:51 | 300 | 98.216 |
| 4/10/2007 | 13:23:37 | 330 | 98.215 |
| 4/10/2007 | 13:26:14 | 360 | 98.192 |
| 4/10/2007 | 22:49:48 | 390 | 98.193 |
| 5/10/2007 | 08:50:18 | 420 | 98.171 |
| 5/10/2007 | 08:57:52 | 450 | 98.186 |
| 5/10/2007 | 12:45:56 | 480 | 98.187 |
| 5/10/2007 | 13:13:10 | 510 | 98.197 |
| 5/10/2007 | 13:24:35 | 540 | 98.191 |
| 5/10/2007 | 18:23:46 | 570 | 98.198 |
| 5/10/2007 | 21:43:05 | 600 | 98.187 |
| 5/10/2007 | 21:46:40 | 630 | 98.199 |
| 5/10/2007 | 22:59:42 | 660 | 98.192 |
| 8/10/2007 | 07:18:23 | 690 | 98.207 |
| 8/10/2007 | 09:09:06 | 720 | 98.21 |
| 24/10/2007 | 06:50:06 | 1 | 98.209 |
| 24/10/2007 | 10:59:44 | 30 | 98.193 |
| 24/10/2007 | 12:50:13 | 60 | 98.204 |
| 24/10/2007 | 15:08:16 | 90 | 98.202 |
| 24/10/2007 | 18:13:40 | 120 | 98.222 |
| 24/10/2007 | 22:07:46 | 150 | 98.214 |
| 25/10/2007 | 07:24:32 | 180 | 98.204 |
| 25/10/2007 | 09:24:54 | 210 | 98.166 |
| 25/10/2007 | 12:26:39 | 240 | 98.168 |
| 25/10/2007 | 16:49:41 | 270 | 98.169 |
| 25/10/2007 | 19:38:17 | 300 | 98.175 |
| 25/10/2007 | 22:44:45 | 330 | 98.175 |
| 26/10/2007 | 08:51:41 | 360 | 98.191 |
| 26/10/2007 | 11:49:26 | 390 | 98.19 |
| 29/10/2007 | 06:14:28 | 420 | 98.181 |
| 29/10/2007 | 06:17:54 | 450 | 98.179 |
| 29/10/2007 | 08:39:19 | 480 | 98.187 |
| 29/10/2007 | 12:43:09 | 510 | 98.192 |
| 29/10/2007 | 17:11:26 | 540 | 98.208 |
| 29/10/2007 | 17:48:53 | 570 | 98.195 |
| 29/10/2007 | 20:48:24 | 600 | 98.196 |
| 30/10/2007 | 06:47:31 | 630 | 98.176 |
| 30/10/2007 | 09:30:37 | 660 | 98.186 |
| 30/10/2007 | 13:05:12 | 690 | 98.194 |
We will upload the data to the system.
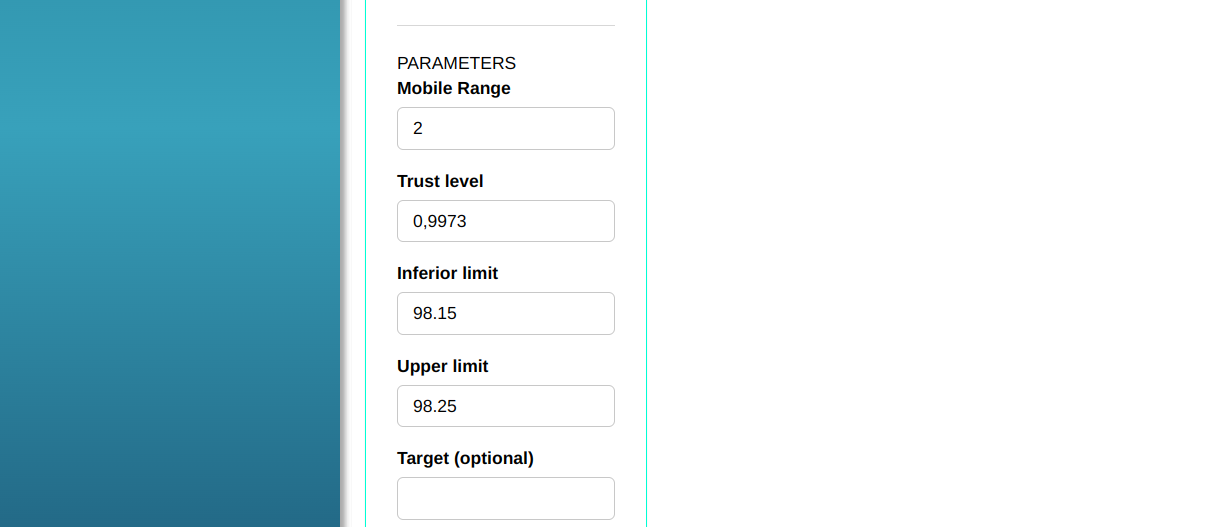
Configuring as shown in the figure below to perform the analysis.
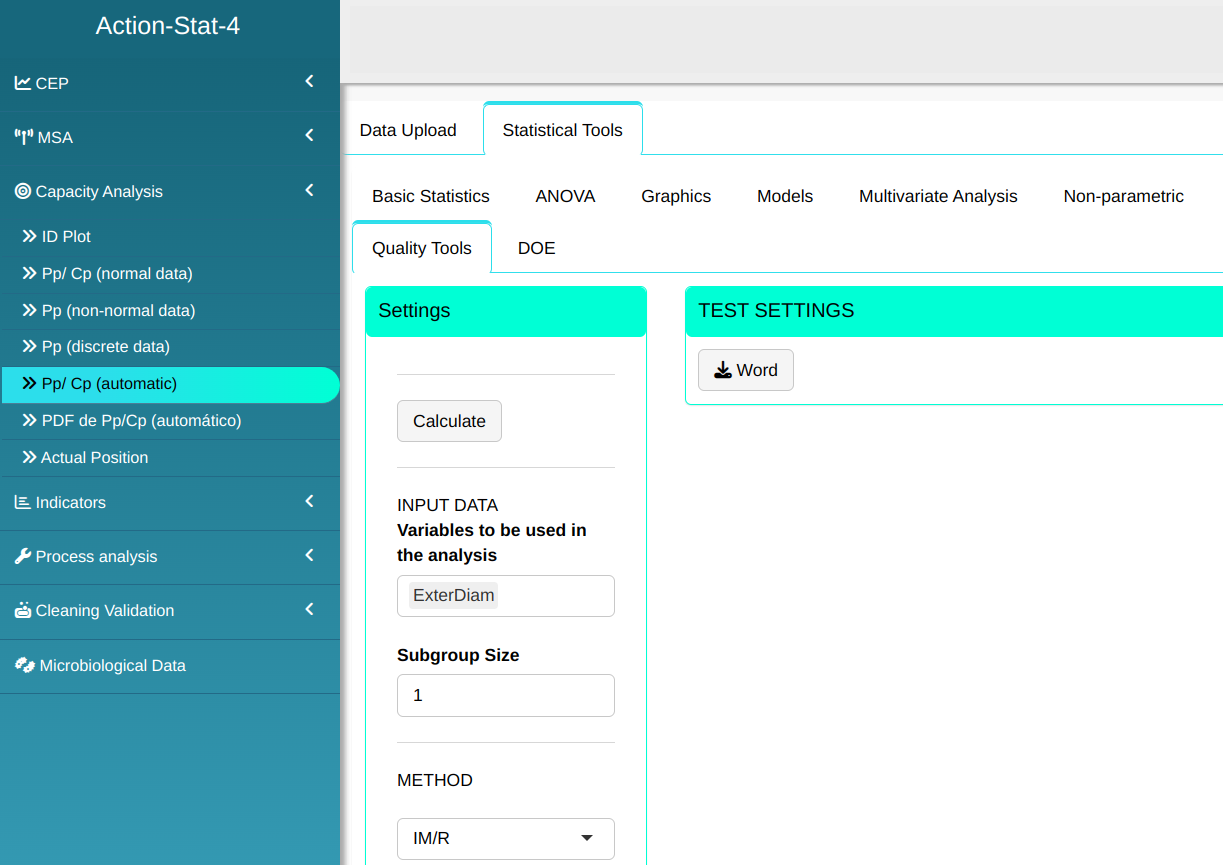

- In “select tests” we can choose the tests we want to carry out.
Then click Calculate to get the results. You can also generate the analyses and download them in Word format.

The results are:
Automatic Analysis
| Process Analysis | Situation |
|---|---|
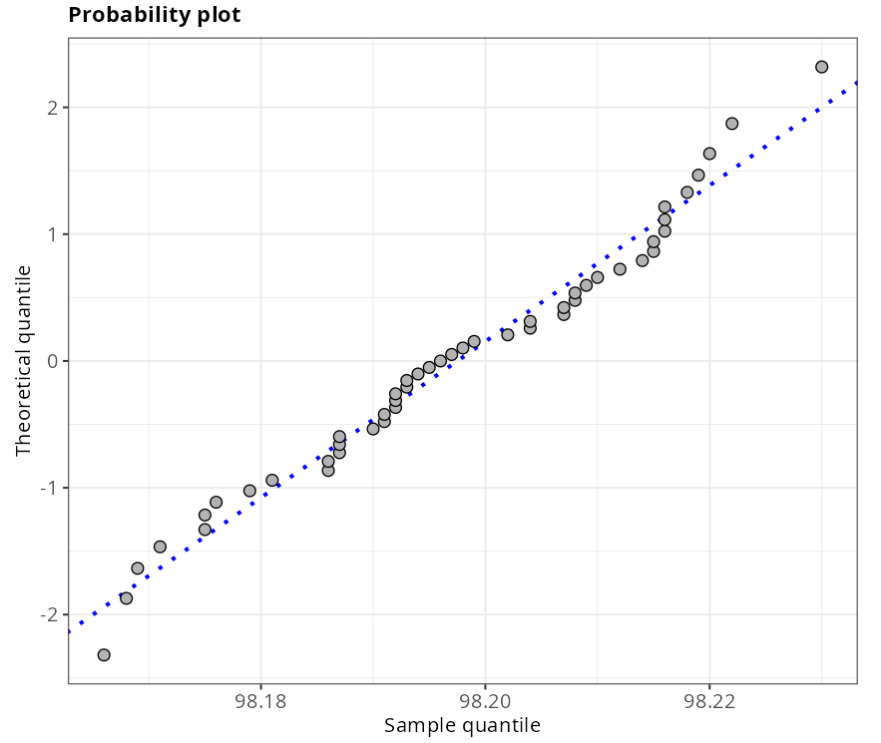
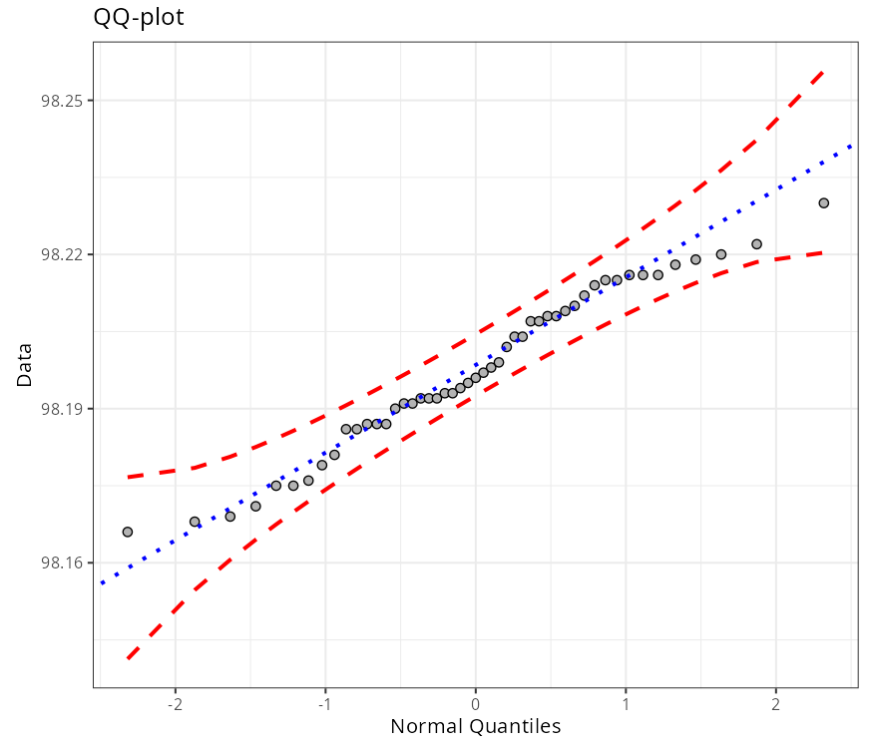
| Normality Test | Accept a 0.05 significance level. |
| Box-Cox Transformatiion | Not Applicable |
| Johnson Transformatiion | Not Applicable |
| Non-Normal Distribution | Not Applicable |
| Non-Parametric Distribution | Not Applicable |
Normality Teste
| Statistics | P-values | |
|---|---|---|
| Anderson - Darling | 0.413 | 0.326 |
| Kolmogorov - Smirnov | 0.091 | 0.402 |
| Shapiro - Wilk | 0.973 | 0.316 |
Specifications
| Value | |
|---|---|
| Sample: | 49 |
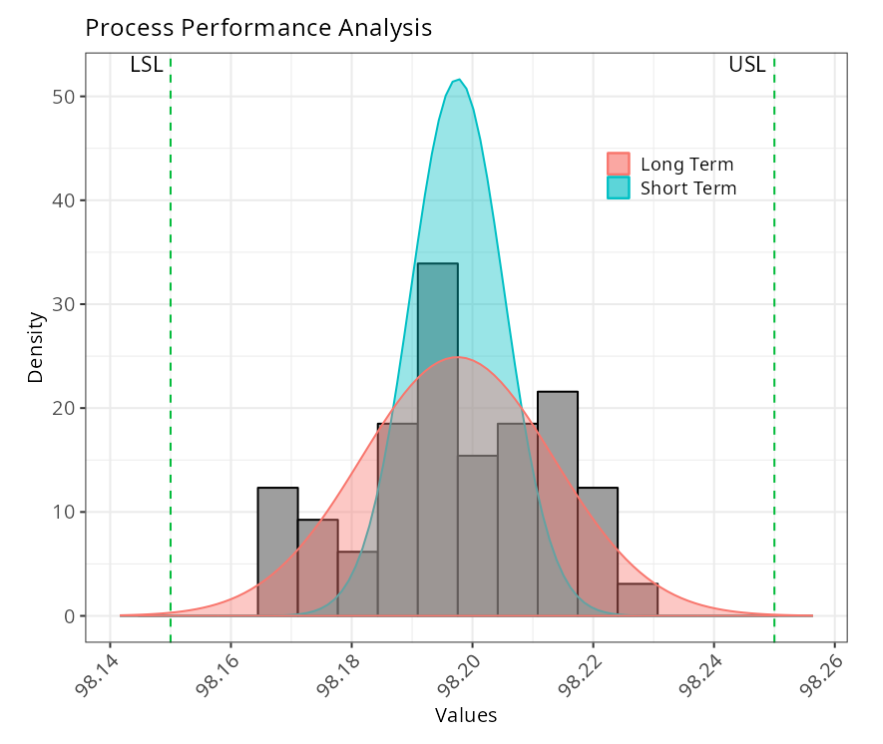
| Lower Limit | 98.15 |
| Upper Limit | 98.25 |
Estimates
| Estimate | |
|---|---|
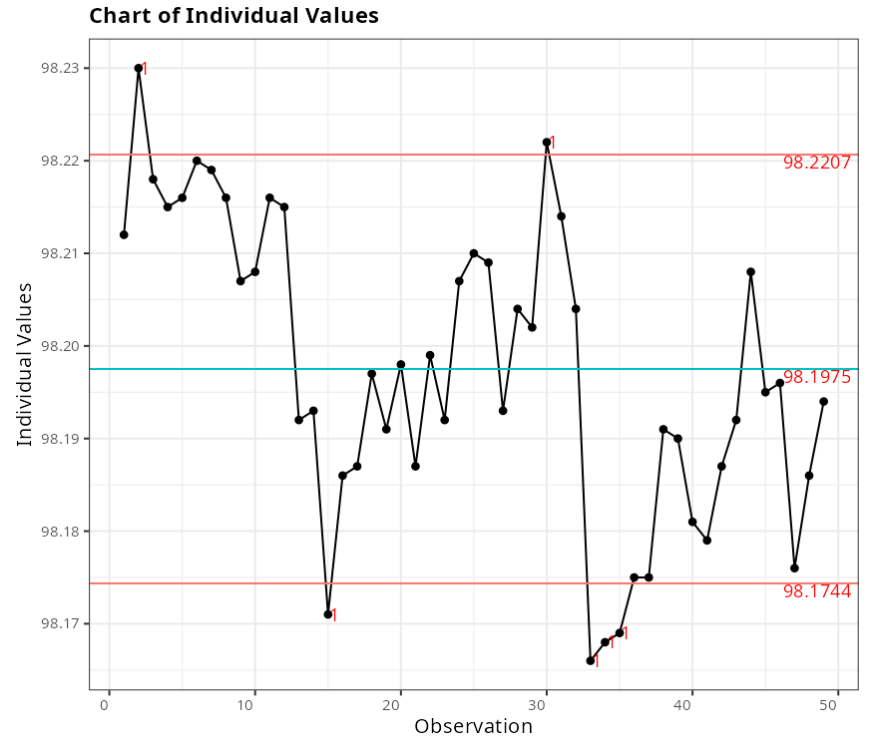
| Mean | 98.198 |
| Standard Deviation (Short term) | 0.008 |
| Standard Deviation (Long term) | 0.016 |
Performance Indices (Long Term)
| Performance Indices (Total Variability) | |
|---|---|
| PP | 1.040 |
| PPL | 0.989 |
| PPU | 1.092 |
| PPK | 0.989 |
Capability Indices (Short term)
| Capacity Indixes (Variability Inherent) | |
|---|---|
| CP | 2.160 |
| CPL | 2.052 |
| CPU | 2.267 |
| CPK | 2.052 |
Observed Indices
| Observed Indices | |
|---|---|
| PPM < LSL | 0 |
| PPM > USL | 0 |
| Total PPM | 0 |
Expected indices (Long term)
| Expected Indices (Short term) | |
|---|---|
| PPM < LSL | 1509.777 |
| PPM > USL | 525.358 |
| Total PPM | 2035.136 |
Expected Indices (Short Term)
| Expected indices (Inherent Variability) | |
|---|---|
| PPM < LSL | 0 |
| PPM > USL | 0 |
| Total PPM | 0 |
SIGMA LEVEL
| SIGMA Level | |
|---|---|
| Zbench (long term) | 2.873 |
| Zbench (short term) | 6.154 |
| Zshift | 1.500 |
| Sigma Metrics | 4.373 |
Last modified 19.11.2025: Atualizar Manual (288ad71)